Cell Confluence
Rapid and robust cell culture confluence control for standardization of virology assays
Introduction
The quality control (QC) department of the Boehringer Ingelheim site in Lyon St Priest (France) is intensively using the CYTONOTE from IPRASENSE to automatically measure the confluence of their daily cell cultures. When the cells proliferate and reach a certain level of confluence, the cell culture flasks are used for virus testing. These virology assays confirm the absence of any viral foreign agent in the product to be controlled (from raw materials of animal origin to distributed vaccine). Various types of viruses are targeted for the manufacture of veterinary vaccines. To perform this cell culture confluence control, more than a hundred flasks are monitored every day with the CYTONOTE. This new automatic technique is now replacing the traditional microscope operator related method. This has proven to significantly improve the repeatability of the results.
Cell confluence assay
The CYTONOTE is able to recognize cells without any labelling. The HORUS software automatically calculates cell number, cell saturation, cell area, cell concentration, cell morphology … Contrary on a conventional microscope, the absence of focus in the CYTONOTE allows an extremely wide field of view of the analyzed image. With this instrument, the confluence measurement is done automatically on a large field of view representative of the cell culture.
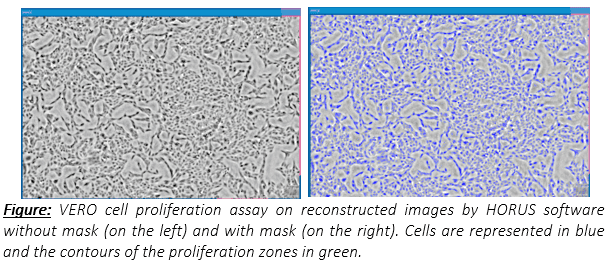
On this picture , VERO cell line is cultivated in flasks of 150 cm². Image acquisition was performed with the CYTONOTE. As described in this picture, cell confluence can be observed and measured.
A member of the quality control department of the Boehringer Ingelheim site in Lyon said
«On daily basis, we test around twenty cell lines in flasks of 75 and 150 cm² to have a larger culture area.»
Results
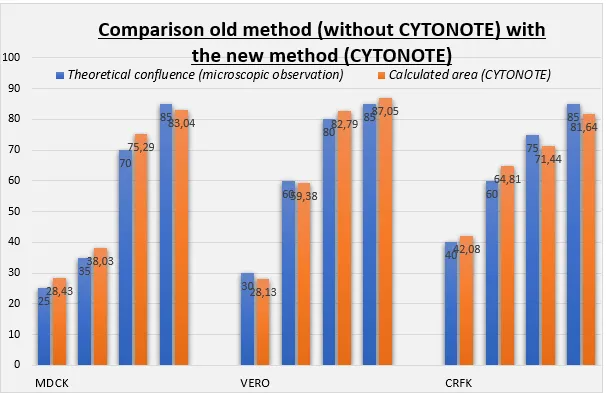
About twenty cell lines tested, only 3 cell line datas (VERO, CRFK and MDCK) were shown for the experiment. And for each of them, 4 flasks were tested. Each orange bar corresponds to the average of 6 images taken with the CYTONOTE 6W. Each blue bar corresponds to the microscopic observation of confluence. The HORUS software algorithm for confluence determination has been adjusted to match with the traditional observation microscopically. According to this graph, we can demonstrate that the results obtained by calculation on the HORUS software with the CYTONOTE are similar to those obtained with the traditional microscopic observation. It depends on each cell line and the conventional observation sensitivity of the operator.
Conclusion
The CYTONOTE allows repeatable and reproducible results to measure cell confluence. In fact, the traditional method with the operator eye through a microscope, only allow to view 2 mm² per field of view. Even if the operator is checking up to 4 different flask location, the CYTONOTE covers twenty times more surface. This comes from the 6 cameras of nearly 30 mm² of the CYTONOTE 6W, it is now possible to look at 180 mm² of the flasks. As a result, the very large intra-operator variability (30%) is now reduced to 3% with the CYTONOTE and the HORUS software calculation. Today, all the flasks are automatically measured with the CYTONOTE for more representative results and more efficient daily readings.