Angiogenesis
Quantification of endothelial cellular network formation for in-vitro angiogenesis analysis
Introduction
Angiogenesis is the physiological process through which new blood vessels form from pre-existing vessels in the earlier stage of vasculogenesis. Angiogenesis is a normal and vital process in growth and development, as well as in wound healing and in the formation of granulation tissue. However, it is also a fundamental step in the transition of tumors from a benign state to a malignant one, leading to the use of angiogenesis inhibitors in the treatment of cancer.
The CYTONOTE allows to study angiogenesis and cellular network formation over large field of view (29.4 mm²) and extended period of acquisition (days to weeks). The CYTONOTE is able to analyse the meshes of endothelial cell network, the number of junctions, the number of branching intervals, the number of master segments, and the steps of analysing vascular endothelial cells into tubes. As a case study, we have analyzed and quantified the spontaneous network formation of HUVEC endothelial cells on 3D extracellular matrices.
Material and method
The CYTONOTE is able to perform measurements inside the incubator and it recognizes cells without any labelling. In standard, the HORUS software automatically calculates cell number, cell saturation, cell area, cell concentration, cell morphology … Unlike a conventional microscope, the absence of focus in the CYTONOTE allows an extremely wide field of view. The CYTONOTE is used in combination with the “Angiogenesis Analyzer” module from HORUS software.
For the experiment, primary human umbilical vein endothelial cells (HUVEC) are cultivated on liquid Matrigel (BD Biosciences) in Petri dish of 35 mm² and incubated at 37°C.
Results
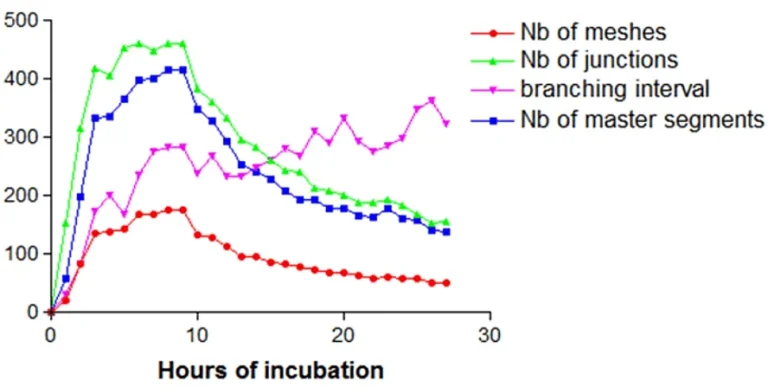
The plot of the different devised metrics as a function of time clearly define three different steps for the network formation: initiation, a stabilization period and then the fusion of meshes. During the first 4 hours, the network is in formation: the number of meshes increases, and so do the number of segments and junctions. Following this, for 6 hours, the network remains stable. Towards the end, the meshes merge to form larger meshes. After 24 hours, the networks present the following architecture: total meshes area of 9 mm², with 60 meshes, with an average size of 0,15 mm².
Conclusion
The CYTONOTE combined with the “Angiogenesis Analyzer” module from HORUS software provides a unique mean to perform cell tube formation assay, to quantify angiogenesis and to screen ex-vivo anti-angiogenic conditions. This method is label-free, high-throughput, ease of use, working directly inside the incubator and relatively low-cost.
Download
You can download the full application note in PDF format here !