Authors: Cédric Allier1, Lionel Hervé, Chiara Paviolo, Ondrej Mandula, Olivier Cioni, William Pierré, Francesca Andriani, Kiran Padmanabhan, Sophie Morales.
25 January 2022 – https://www.frontiersin.org/articles/10.3389/fphy.2021.776805/full
We present a novel deep learning-based quantification pipeline for the analysis of cell culture images acquired by lens-free microscopy. The image reconstruction part of the pipeline features a convolutional neural network performing phase unwrapping and accelerating the inverse problem optimization. It allows phase retrieval at the 4K level (3,840 × 2,748 pixels) in 3 s. The analysis part of the pipeline features a suite of convolutional neural networks estimating different cell metrics from the reconstructed image, that is, cell surface area, cell dry mass, cell length, and cell thickness. The networks have been trained to predict quantitative representation of the cell measurements that can be next translated into measurement lists with a local maxima algorithm. In this article, we discuss the performance and limitations of this novel deep learning-based quantification pipeline in comparison with a standard image processing solution. The main advantage brought by this method is the fast processing time, that is, the analysis rate of ∼25.000 cells measurements per second. Although our proof of principle has been established with lens-free microscopy, the approach of using quantitative cell representation in a deep learning framework can be similarly applied to other microscopy techniques.
1. Introduction
Convolutional neural networks (CNNs) have proven to efficiently process microscope images of cell cultures. CNN can perform image de-noising, cell detection, cell segmentation, cell virtual staining, cell classification, cell motility estimation, and so on. To date, CNNs outperform standard image processing algorithms in terms of performance and computation speed. Thus, a set of CNNs can replace conventional algorithms into image processing pipelines of cell culture analysis. To go further, we are studying whether the full image processing pipeline could be efficiently replaced with a single CNN. This implies addressing two major issues. Firstly, the CNN must be able to perform cell features quantification. As mentioned previously, CNNs are efficient in conducting image transformation, but the quantification of cell features/cell shapes is not trivial. Secondly, the output of a CNN is of finite dimensions, whereas the dimensions of a vector list of cell measurements depend obviously on the number of cells present in the image. To address these issues, we studied CNNs that map cell culture image into quantitative representations of cell measurements. Further processing of the representations with a local maxima algorithm provides the lists of cell measurements. Note that a CNN predicting quantitative cell representations has already been successfully implemented to compute cell positions and motions. In this work, we study the possibility to quantify other cell metrics, namely, dry mass, surface area, maximum optical thickness, and major axis length. We demonstrate that single CNNs applied to optical path difference image (OPD) of cell culture obtained with lens-free microscopy deliver results in agreement with standard image processing. We found that the CNNs can generalize well over different conditions of acquisition. They are robust over noise, can handle the presence of non-uniform background, and perform well up to a cell concentration of 365 cells/mm2. At this concentration, the OPD image acquired with lens-free microscopy (29.4 mm2) features ∼11.000 cells. The application of a single CNN followed by the local maxima algorithm to this image lasts for 0.44 s on a 16 GB GPU board. As a result, the obtained analysis rate is as high as ∼25.000 cell measurements per second. In the case of lens-free microscopy, the time to results is then impaired by the time needed to reconstruct the OPD image. Therefore, we developed and tested a CNN-based acceleration of the reconstruction, reducing the computation time from 200 to 3 s. The CNNs applied to these fast reconstructions deliver results in agreement with the reference values.
Overall, we discuss a CNN-based pipeline dedicated to lens-free microscopy, which allows acquiring and conducting multi-parameter analysis of ∼10,000 cells in less than 5 s. Although the proof of principle has been established for lens-free microscopy images and a given cell line, the proposed approach of CNN-based quantification can be easily adapted to other samples, microscope modalities, dataset dimensions, and other cell measurements. Thus, designing deep learning solutions with quantitative cell representations forms a novel and efficient framework for bio-imaging analysis.
2. Materials and Methods
2.1. Lens-Free Microscopy
We performed image acquisitions of adherent cells directly into a cell culture incubator with a lens-free microscope (Iprasense Cytonote). The microscope features a RGB LED source spatially filtered with a 50 µm diameter pinhole and located 50 mm away from the sample. A CMOS detector (6.4 × 4.6 mm2, 3,840 × 2,748 pixels of 1.67 μm pitch) acquires three diffraction patterns (RGB) of the cell culture at a sample-to-sensor distance of z ∼ 1 mm with an integration time of 300 ms. The lens-free setup records only intensity measurements in the sensor plane. OPD and absorption images in the sample plane are obtained through a reconstruction algorithm detailed in Section 2.2. OPD is related to phase shift and refractive index according to the following:

where n is the local sample refractive index, nmedium is the refractive index of the surrounding medium, h is the thickness of the sample object, and λ is the illumination wavelength. The OPD values can be integrated over the total projected area S of the cell to determine the optical volume difference (OVD, expressed as a unit of volume in µm3)

A relationship between the phase shift measurement and the cell mass has been defined for adherent cell culture and can be used to translate OVD into cell dry mass (CDM), the mass of all cellular content except for water. With our notations, this relationship is given by

where α is the specific refractive increment, which relates the refractive index change to an increase in mass density. In mammalian cells, the specific refractive index of intracellular components falls with a narrow range, and Barer estimated a constant α of 0.18 μm3 pg−1.
2.2 Alternation of Deep Learning and Inverse Problem Optimization for Image Reconstruction
In lens-free microscopy, a reconstruction process is needed to retrieve OPD and absorption images from intensity measurements recorded ∼1 mm away from the sample. Reconstruction is based on an inverse problem that we tackled with the method, where the reconstruction alternates between two approaches: inverse problem optimization and deep learning solution (Figure 1). The computation starts with a first inverse problem optimization processing the RGB acquisitions (10 iterations, Figures 1E, G). In a second step, a neural network is applied to improve the reconstruction result (Figures 1E, H). In the last step (10 iterations), the CNN prediction is used as the initialization of a second inverse problem optimization, which ensures data fidelity (Figure 1F, I, J). We built two different reconstruction algorithms with two distinct CNNs. In the first reconstruction algorithm, the CNN is used to correct phase wrapping. It is trained with synthetic pairs of images, with and without phase wrapping. The inverse problem optimizations are processed over 153 iterations with complex regularization criteria. With this algorithm, the reconstruction of ∼30 mm2 OPD image lasts for 200 s on a 24 GB-GPU board. In the following, we will call this algorithm the reference reconstruction algorithm. In the second reconstruction algorithm, the CNN is used to perform phase unwrapping and accelerate inverse problem optimization. To this aim, the CNN has been trained with pairs of images being the results of the inverse problem optimization with low (10) and high number (153) of iterations. The last step of this algorithm conducts 10 iterations of inverse problem optimization with simplified regularization criteria. With this algorithm, the reconstruction of ∼30 mm2 OPD image lasts for 3 s on a 24 GB-GPU board. In the following, we will call this algorithm the accelerated reconstruction algorithm. For the two CNNs, we use the same simple architecture consisting of 20 internal layers composed of 16 features. The operations to proceed from one layer to the next are batch normalization, convolutions with 3 × 3 kernels, and ReLU non-linear function. No down-sampling or up-sampling processes are involved to maintain (or so as to maintain) the original dimensions of entry images through layers. Inputs and outputs of the CNNs are pairs of images, that is, OPD and absorption images. CNNs are trained with small 128 × 128 pixels images, but they can still be applied to larger size images. The CNN training was performed with 30,000 pairs of images over 20 epochs.
Figure 1
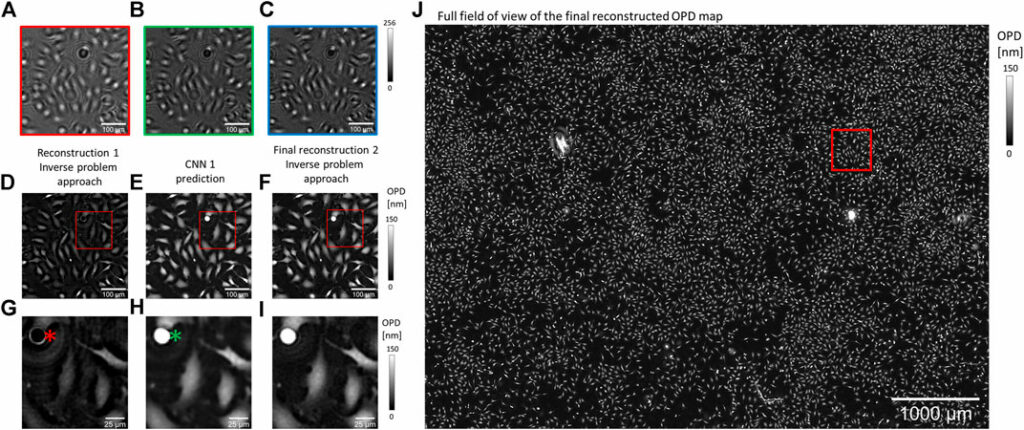
FIGURE 1. Alternation of deep learning and inverse problem optimization for OPD image reconstruction. (A,B,C) RGB lens-free acquisitions of a fibroblast adherent cell culture. These are cropped images of a large field of view acquisition (29.4 mm2). (D-I) Details of the reconstructed OPD map at different steps of the reconstruction (see red box in (J)). (G,H,I) Details of (D,E,F), respectively (see red boxes in (D,E,F)). (D,G) Reconstructed OPDs after the first reconstruction step were obtained with the inverse problem approach. (E,H) The CNN is applied to perform phase unwrapping and estimate the result of an inverse problem optimization with many iterations. The red asterisk in (G) points to a cell undergoing mitosis that has been incorrectly reconstructed with a low OPD. This error is well corrected by the CNN prediction as pointed in (H) with a green asterisk. (F,I) The last reconstruction step relies on an inverse problem optimization initialized with (E,H). (J) Full field of view showing the final reconstruction of the OPD image (∼30 mm2).
2.3 Convolutional Neural Networks Training With Quantitative Cell Representation
The analysis part of the pipeline is a set of CNNs predicting quantitative cell representations from the reconstructed cell OPD image (Figure 2). The CNN prediction is then a heat map image representing each cell with a 6 pixels (10 µm) diameter disc, with pixel intensity corresponding to the cell measurement of interest. The structure used for the CNN is similar to that used for image reconstruction, with 20 layers and 32 features. To train the CNNs and evaluate their performances, we used an experimental dataset built upon 234 OPD images of 30 mm2 featuring ∼2 million cells. To gather the ground truth dataset, we applied a standard image processing pipeline to the lens-free acquisitions (Figure 2A). Cell detection was obtained with the FIJI TrackMate plugin (Figure 2B). Cell segmentation was achieved with a seeded growing segmentation algorithm controlled by a threshold value delineating the separation between background and cell area (Figure 2C). With this image processing pipeline, we processed the following metrics (Figures 2B–E): the cell position in pixels, the cell surface area in µm2, the maximum OPD in nm (Eq. 2), the cell dry mass in pg (Eq. 4), and the cell length along the principal axis in µm. The results of the image processing pipeline were used to generate ground truth quantitative cell representations used as a target for CNNs training (Figures 2F–I). CNNs training was performed with 50,000 pairs of images (128 × 128 pixels of 1.67 µm pitch) over 100 epochs. CNNs were trained with about 10% of the ∼2.106 acquired cell images.
Figure 2
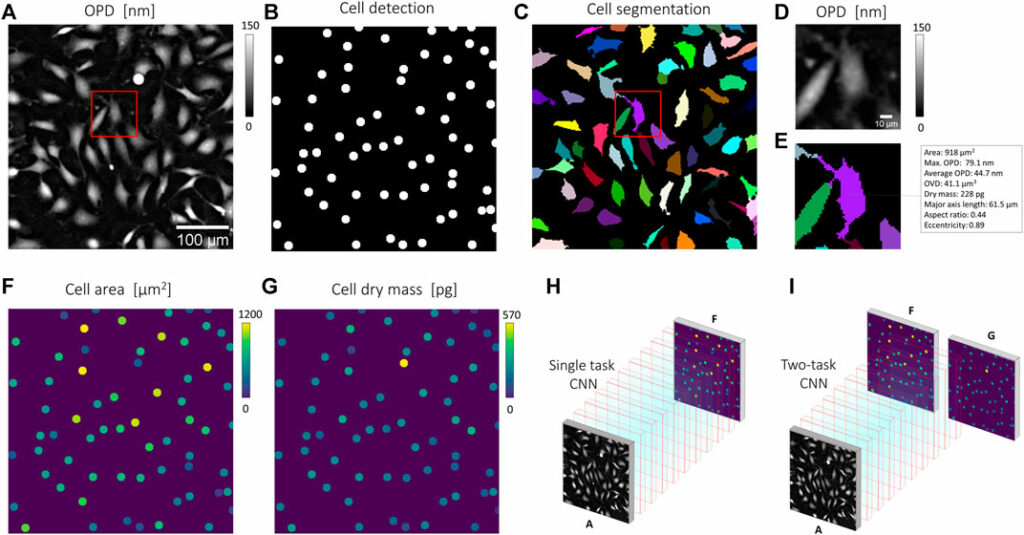
FIGURE 2. Quantitative representation for CNN training. (B,C,E) Results of a standard imaging processing pipeline applied to (A), a reconstructed OPD image of fibroblast cells acquired by lens-free microscopy. (B) Cell detection obtained with the detection module of FIJI TrackMate plugin [18]. (C) Cell segmentation obtained with a seeded growing algorithm. (D-E) Details of the red box in (C) showing an OPD map (D) and corresponding cell measurements calculated for the cell depicted in purple (E). The cell segmentation in (C) allows the calculation of the cell area, the cell dry mass (Eq. 4). These measurements can next be translated into quantitative cell representations (F,G), where each cell is represented by a six-pixel (10 µm) diameter disc with pixel intensity corresponding to individual cell measurements. (H) A CNN can be trained to translate OPD map (A) into quantitative cell representation, here that of cell area (F). (I) A CNN can be trained to predict multiple quantitative cell representations, here that of cell area (F) and cell dry mass (G).
2.4 Results Analysis
To measure the discrepancies between the quantitative representation predicted by a CNN and the reference, we calculated the structural similarity index (SSIM). To assess the detection performances of the CNN-based pipeline, we calculated precision and recall values considering a maximum pairing distance of 10 µm. To assess the performance of the CNN-based quantification pipeline, the estimated cell measurement values were compared to the values obtained with the standard image processing pipeline. We performed linear regression fits to obtain the coefficient of determination R2, slope, and intercept. The root mean square deviation (RMSD) is frequently used to measure the error between ground truth and estimated values. However, it is strongly influenced by the presence of outliers. Therefore, we have calculated the absolute deviation from the median (MAD):

where M is the median of a series and b = 1.4826 is a constant linked to the assumption of data abnormality. All analysis calculations have been performed with MATLAB® libraries.
2.5 Culture of Adherent Cells
A wild-type lung mouse fibroblasts cell line was generated from C57BL/6 mice. Cells were cultured and serially passaged in Dulbecco’s Modified Eagle’s Medium-high glucose (Sigma-Aldrich) supplemented with 10% fetal calf serum (FCS, Thermo Fisher), penicillin (25 units/mL, Thermo Fisher), and streptomycin (25 units/mL, Thermo Fisher). For lens-free imaging, 104 cells were plated on 35 mm dishes and subsequently imaged every 10 min.
3. Results of Convolutional Neural Network-Based Quantification Obtained on Experimental Data
Our CNN pipeline was trained on an experimental dataset featuring 234 OPD images of adherent fibroblast cells obtained with lens-free microscopy. The reconstruction of ∼30 mm2 OPD images (see Supplementary Figure S1 for OPD value distribution) was performed with our reference algorithm, which consists of 153 iterations of inverse problem optimization and lasts for 200 s on a 24 GB-GPU board. We established ground truth quantitative representations with the results of a conventional image-processing pipeline applied to the reconstructed OPD images. With this ground truth dataset, four different CNNs have been trained to quantify cell dry mass, cell surface area, cell maximum optical thickness, and cell major axis length, respectively. Test images are taken from the same dataset but were not used during CNNs training. Figure 3 depicts the results obtained with different CNNs on a test image featuring 7,568 fibroblasts (density of ∼255 cells/mm2, Figure 3A). The CNN predicted quantitative representations and ground truths for the four different cell measurements are shown in Figures 3C, F, I, L and Figures 3D, G, J, M, respectively. CNN predictions are close to the ground truth, with SSIMs larger than 0.93 (Table 1). The application of local maxima algorithm to the CNN predictions allows cell detection with precision and recall greater than 0.99. Pair-wise comparisons between predicted and ground truth measurements show that the CNN predictions of cell dry mass, cell area, maximum OPD, and cell major axis length correlate well with the ground truth (Figures 3 E, H, K, N, R2 ≥ 0.82 at density of ∼255 cells/mm2; see Table 1). These good correlations demonstrate the ability of CNNs to quantify cell measurements. The CNN applied to single value measurements (e.g., maximum OPD) shows the best correlation with ground truth values (R2 = 0.944), but the correlation is not fully linear (Figure 3H). The CNNs applied to integral calculation (e.g., area and dry mass) perform well (R2 ≥ 0.87), and the comparison with ground values is linear. However, the CNN presents a difficulty in quantifying a geometrical feature (e.g., major axis length, Figure 3N, SSIM = 0.89, R2 ≤ 0.85). Thus, these results indicate a hierarchical complexity for the CNN to perform the different cell quantification tasks.
Figure 3
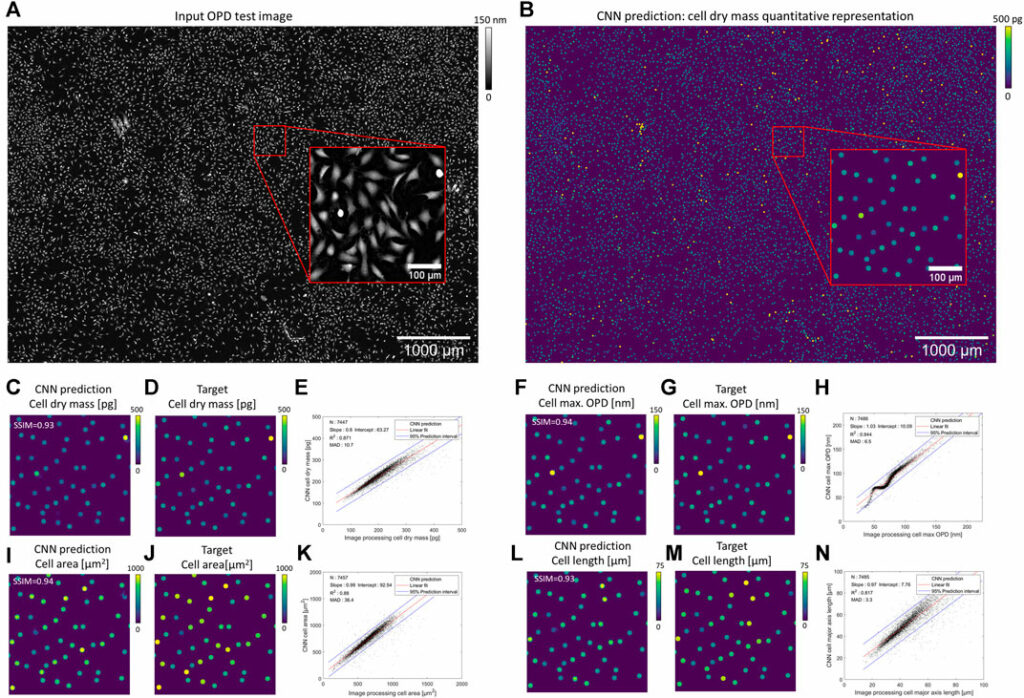
FIGURE 3. Results of CNN-based quantifications compared with ground obtained with standard image processing (A) OPD test image featuring 7,568 fibroblasts. (B) CNN prediction of a cell dry mass quantitative representation. For better visualization, discs have been dilated in (B). (C, F, I, L) Quantitative representations predicted by the CNN on the OPD cropped image (red box in (A)) for cell dry mass, cell maximum OPD value, cell area, and cell major axis length. Corresponding ground truth representations are depicted in (D, G, J, M), respectively. (E, H, K, N, S) Pair-wise comparisons between predicted and ground truth values for the four cell metrics over N = 7,450 cells. The results of the linear regressions and the error MAD calculation (Eq. 6) are indicated in the figures.
Table 1
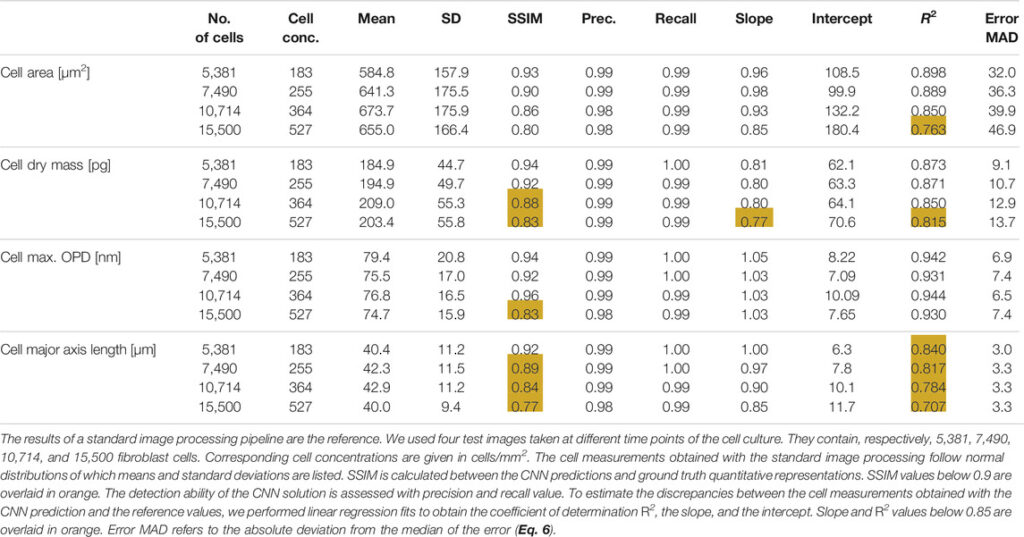
TABLE 1. Results of CNN-based quantifications obtained on OPD test images reconstructed with the reference reconstruction algorithm (200 s computation time).
In terms of computation time, the activation of one CNN applied to a full field of view OPD image (∼30 mm2) lasts for 0.21 s on a 16 GB GPU board. The implementation of the CNN was done under a C++ environment using TensorRT® librairies. The application of the local maxima detection algorithm needed to extract the cell measurements list from the CNN prediction lasts for 0.23 s. On the test image featuring ∼7,500 cells, the total analysis time is thus 0.44 s yielding an analysis rate of 17,000 cell measurements per second. The rate can be further increased using a CNN quantifying two cell measurements at once. We trained such a CNN, predicting simultaneously cell dry mass and cell area quantitative representations (see Figure 2I). The two-task CNN is not larger in size than a single task CNN, and its activation lasts similarly for 0.21 s on the 16 GB GPU board. The time to results is then impaired by applying the local maxima algorithm lasting for 0.46 s to process the two quantitative representations. It follows that the two-task CNN analysis rate increases up to ∼23,000 cell measurements per second without impairing the comparison with ground truth (Supplementary Table S1). Thus, the analysis process becomes much faster than the image reconstruction, namely, 200 s for the reference reconstruction algorithm. To obtain with lens-free microscopy a total time to results in the order of seconds, we then developed an accelerated version of the lens-free reconstruction algorithm delivering 30 mm2 OPD image in 3 s. Comparison between the OPD images reconstructed with reference and the fast algorithm is shown in Supplementary Figure S2. Although the reference and fast reconstruction are similar (SSIM ∼0.99, difference<6 nm spatial variation SD; see Supplementary Figure S2), it was necessary to train novel quantitative CNNs with fast image reconstructions to optimize the overall performances. Comparison of fast reconstruction CNNs predictions with ground truths are detailed in Supplementary Table S2. There is a slight degradation in comparison with the results obtained with the reference reconstructions (see Table 1). On the test dataset, the fast reconstruction CNNs yield R2 of 0.83 ± 0.08 to be compared with R2 of 0.86 ± 0.07 obtained with the reference reconstructions. As the performance degradation is low and still quite close to the ground truth (see Supplementary Table S2), it is thus pertinent to couple CNN cell quantification with an accelerated version of the image reconstruction. Thus, it allows imaging and analyzing ∼10.000 cells in less than 5 seconds.
Further, we have tested the influence of the cell concentration on the performances of the CNNs (see Table 1). Test images at different cell concentrations are shown in Supplementary Figure S3. We found that the detection ability of the different CNNs is not influenced by the cell concentration, up to a concentration of 530 cells/mm2 (N = 15,500 cells per 29.4 mm2 OPD image) and precision and recall yield values larger than 0.98 (see Table 1). Similarly, CNN quantification of the maximum OPD value is not influenced by cell concentration. Up to 530 cells/mm2, we measured R2 larger than 0.93 and constant error MAD of ∼7 µm in comparison with reference values. The performance of CNNs quantifying cell area and cell dry mass remains constant up to 365 cells/mm2 (SSIM >0.85, R2 ≥ 0.85; see Table 1) and starts to deviate from the ground truth values at the cell concentration of 530 cells/mm2 (SSIM ≤0.85, R2 ≥ 0.85; see Table 1). The performance of the CNN quantifying the cell major axis length appears to be influenced by cell concentration. The SSIM values and the coefficient of determination R2 both decrease linearly with the cell concentration, down to, respectively, 0.77 and 0.71 for a cell concentration of 530 cells/mm2 (see Table 1). The error MAD increases from 3 to 3.3 µm for cell concentration increasing from 180 to 530 cells/mm2 (see Table 1). CNN quantification of major axis cell length remains a difficult task.
So far, CNNs were trained and tested on experimental OPD images presenting uniform background and low noise. We measured a 1.2 nm spatial variation SD in a background area of 130 × 130 µm2. To evaluate the robustness of the CNNs over larger noise and/or the presence non-uniform background, we have conducted an evaluation task with test OPD images degraded with simulated noise (10 nm SD and 20 nm SD spatial variation) and/or simulated non-uniform background (15 and 30 nm maximum amplitude). The simulated test OPD images are shown in Supplementary Figure S4. Figure 4 shows the results of this evaluation task for CNNs quantifying cell dry mass. The CNN-A, trained with the experimental OPD images discussed previously (see Table 1), performs poorly on the evaluation task. On the pair-wise comparisons with the reference values, the CNN-A quantification yields R2 of 0.73 ± 0.15 and error MAD of 21.6 ± 8.5 pg depending on the image quality (see Supplementary Table S3). In order to improve the robustness over image quality, we trained CNN-B with input OPD images degraded with noise (20 nm spatial variation SD) and non-uniform background (30 nm maximum amplitude). Consequently, the CNN-B presents good robustness over different levels of image quality. On the test dataset, it yields R2 of 0.86 ± 0.02 and error MAD of 17.7 ± 3.6 pg depending on the level of image quality (see Figures 4G, H, Supplementary Table S3).
Figure 4
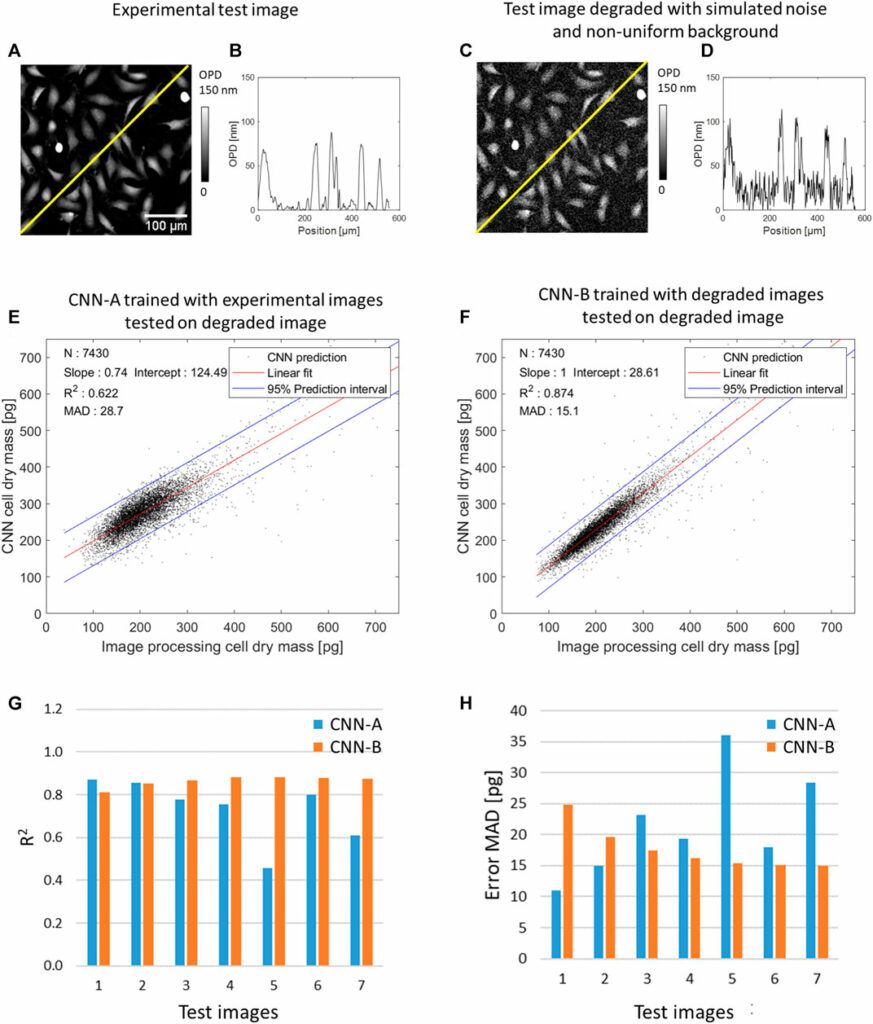
FIGURE 4. Results of CNN-based quantification of cell dry mass applied to a test OPD image featuring 7,490 cells with and without numerical degradations. (A) Detail of the test experimental OPD image. (B) OPD profile along yellow line in (A). (C) Test OPD image degraded with simulated noise (20 nm spatial variation SD) and non-uniform background (30 nm maximum amplitude). (D) OPD profile along yellow line in (C). (E) CNN-A trained with images free of simulated degradation applied to the image numerically degraded (see (C, D)), pair-wise comparison with the ground truth results over N = 7,450 cells. (F) CNN-B trained with degraded images applied to the degraded image, pair-wise comparison with the ground truth results over N = 7,450 cells. (G) and (H) Results of the evaluation task conducted with CNN-A and CNN-B over different levels of image quality (x7, see Supplementary Figure S3). R2 and error MAD (Eq. 6) are calculated on the pair-wise comparison with ground truth values. Test image 1 is the experimental OPD image (N = 7,450 cells) without simulated degradation. Test images 2 and 3 are the OPD image degraded with noise of 10 nm SD and 20 nm SD, respectively. Test images 4 and 5 are the OPD image degraded with non-uniform background of 15 and 30 nm maximum amplitude, respectively. Test images 6 and 7 are the OPD image degraded with noise and non-uniform background, that is, noise of 10 nm SD with non-uniform background of 15 nm maximum amplitude and noise of 20 nm SD with non-uniform background of 30 nm maximum amplitude, respectively.
4. Discussion
In this article, we compare the results of CNN cell quantifications with the results obtained with a standard image processing pipeline. The latter are not precise enough to serve as an absolute reference for a metrology study. To conduct a metrology study, additional cell measurements obtained with quantitative phase imaging technique surpassing lens-free microscopy in terms of spatial resolution, spatial noise, and phase sensitivity are needed. This goes beyond the scope of the present article, and for this reason, the present work cannot assess the precision and accuracy of the CNN quantification in an absolute manner.
Nevertheless, the results discussed in this article allow concluding the first proof of principle. Results obtained on experimental data demonstrate that CNNs trained with quantitative cell representations can estimate different cell measurements: area, dry mass, maximum OPD value, and major axis length. When applied to lens-free microscopy acquisitions, the cell measurements correlate well with the results of a standard image processing solution. We observed a hierarchical complexity for the CNN quantification tasks. Measurements involving quantification of single values and integral calculations (e.g., cell area, cell dry mass, and maximum OPD value) were found to be in good agreement with the ground truth. Conversely, the quantification of geometrical features needed to determine cell length deviates from the ground truth. At this stage, we do not have any explanation for this observation. For dry mass measurements, we trained a CNN that performed well on different levels of image quality, yielding predictions in good agreement with the ground truth. Here, we are emphasizing that a single CNN without parameters tuning can thus reproduce the results of a standard processing pipeline that conducts a sequence of many different tasks: de-noising, baseline subtraction, cell detection, cell segmentation, and cell dry mass calculation.
We found a good correlation with ground truth values up to a cell density of 365 cells/mm2. This corresponds to the presence of 11.000 cells per image and about ∼40% of the confluence stage. An image being processed for 0.44 s yields a fast analysis rate of ∼25.000 cell measurements per second. These results set an upper limit for the method in terms of analysis rate, cell density, and confluency. To cope with the high analysis rate, we had to develop an accelerated version of our lens-free reconstruction algorithm delivering now 30 mm2 OPD image in 3 s instead of 200 s for the reference reconstruction algorithm. It thus allows phase retrieval at the 4K level (3,840 × 2,748 pixels) in a few seconds. This fast computation time compares well with the recent achievement of a phase retrieval at 8K level (7,680 × 4,320 pixels) in minute-level time. The results of CNNs trained with these fast reconstructions remain in line with the ground truth. Overall, we have developed a CNN-based pipeline dedicated to lens-free microscopy conducting multi-parameters analysis of ∼10,000 cells in ∼10 s. The detailed time to results is as follows:
(A) Multi-wavelength acquisition 7 s,
(B) First inverse problem optimization 0.7 s,
(C) CNN phase unwrapping, acceleration of the inverse problem optimization 0.4 s,
(D) Second inverse problem optimization 0.7 s,
(E) CNN cell dry mass quantification 0.21 s,
(F) Local maximum algorithm 0.23 s,
(G) CNN cell area quantification 0.21 s,
(H) Local maximum algorithm 0.23 s,
(I) CNN cell maximum OPD quantification 0.21 s,
(J) Local maximum algorithm 0.23 s,
(K) CNN major axis length quantification 0.21 s,
(L) local maximum algorithm 0.23 s.
To date, with lens-free microscopy, imaging and analysis were performed sequentially, with a total time to results in the order of several minutes. Here, imaging and analysis of a large dataset (>10,000 cells) can only last for a few seconds. It is a leap forward in microscopy. With our approach, we can envisage a microscope capable of decision and action. A consequence of great significance is that decision can be supported by CNNs that integrate past analysis to perform time predictions. The resulting actions of CNNs analyzing and predicting cellular behavior in real time, for example, could be direct interactions with the cells in active culture, such as selecting individual cells or clusters of interest for further exploration or biochemical analysis.
Although the proof of principle has been established for lens-free microscopy for a given set of cell features, the approach of using quantitative cell representations in a deep learning framework can be further developed in multiple directions. First, the obtained CNNs can be modified through transfer learning to address other cell types and/or other cell culture conditions, for example, cells cultured in suspensions or Matrigel®. Next, the proposed pipeline could be applied to other microscope modalities, for example, other quantitative phase imaging techniques or epi-fluorescence microscopy. Further, the methodology could be applied to quantify cell changes by encoding the time dimension into the quantitative representation to measure, for example, cell elongation, cell motility, and cell growth rate. Finally, the technique could be applied to the quantitative analysis of 3D cellular structures and their changes over time.
The methodology is a deep learning solution for microscopy studies. Hence, it falls within the framework of the recommendations discussed in. It follows that users of this approach that would train CNN with quantitative representation must validate the CNN predictions against a well-established ground truth. For the present case study, the validation consisted in calculating precision and recall for cell detection and establishing the level of linear correlation between the predicted cell metrics values and corresponding ground truth values. If the approach is applied to other modalities or other cell quantifications, other quality metrics should be considered.
5. Conclusion
In summary, we introduced a novel cell quantitative representation into the deep learning framework. We demonstrated that it is possible to train a single CNN performing quantification of cell measurements to replace a full image processing pipeline. We have shown that CNNs can address different types of cell measurements over a wide range of cell images varying in cell concentration and image quality. As an advantage, the CNN quantification approach benefits from fast computation time. Here, we have demonstrated that this framework allows performing multi-parameters analysis of ∼10,000 cells in a few seconds. As such, CNN quantification can be a leading solution to develop the next event-driven microscopy techniques.
Data Availability Statement
The raw data supporting the conclusions of this article will be made available by the authors, without undue reservation.
Author Contributions
CA is the principal investigator of the study. He conceived the deep learning solution and conducted the evaluation tasks. CA and LH developed the deep learning solution dedicated to image reconstruction. OC and WP developed and tested several deep learning implementations. KP and FA conceived and conducted the bio-imaging experimentations. CP, LH, CP, OM and SM wrote the manuscripts. All authors agree to be accountable for the content of the work.
Funding
This work has received funding from the European Union’s Horizon 2020 research program under grant agreement no. 101016726.
Conflict of Interest
The authors declare that the research was conducted in the absence of any commercial or financial relationships that could be construed as a potential conflict of interest.
Publisher’s Note
All claims expressed in this article are solely those of the authors and do not necessarily represent those of their affiliated organizations, or those of the publisher, the editors, and the reviewers. Any product that may be evaluated in this article, or claim that may be made by its manufacturer, is not guaranteed or endorsed by the publisher.